Achieve a data-driven marketing strategy and get ROI on your efforts
In a perfect world, you could understand your supporters by talking to them individually, but most clubs rely on their supporter data to be able to anticipate behavior. By visualizing your supporter data as real-time actionable insights Data Talks creates value for your club. Data Talks CDP allows you to set up your own analytics without the need to involve Data Scientists, thanks to our self-service analytics scorecards and widgets.
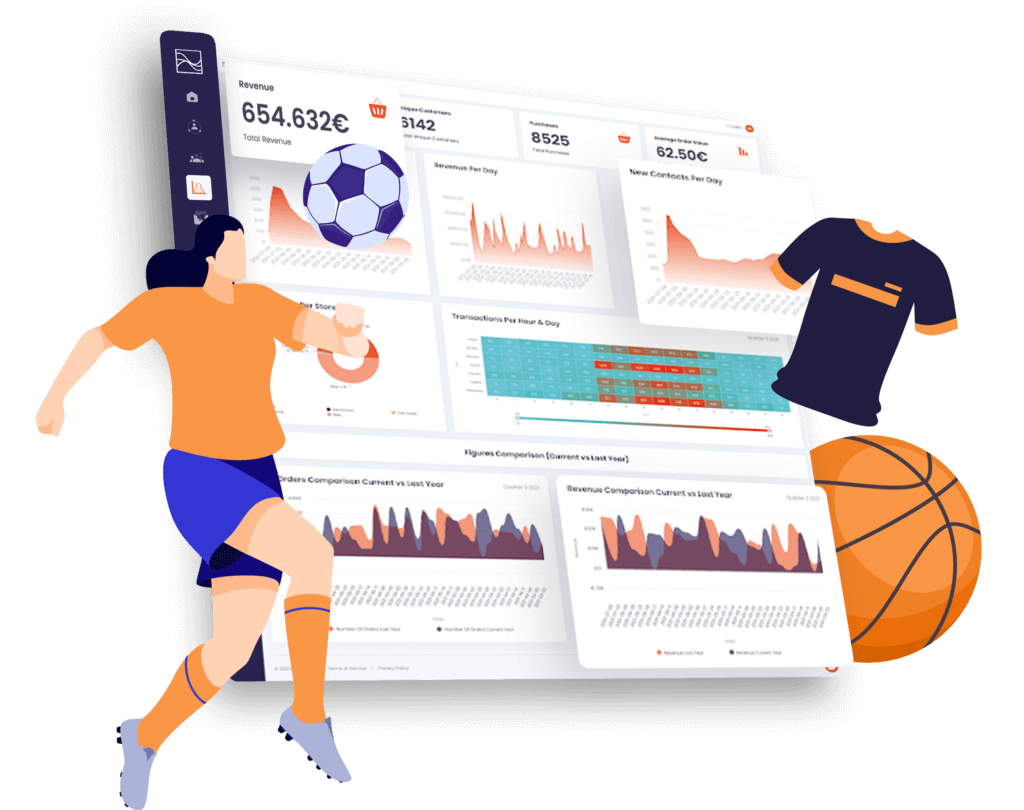
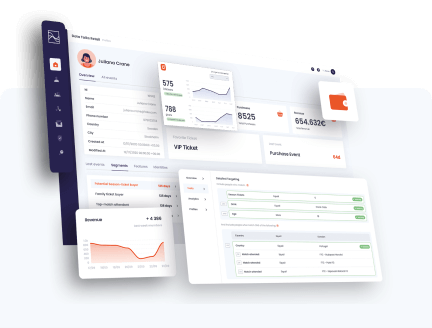
Use our analytics to flexibly create real-time dashboards to visualize and analyze your fan base, and your marketing efforts according to the KPIs you’ve defined. Tracking the right KPIs will allow you to better understand how your supporters interact with your club, and ultimately deliver a better supporter experience.
Since every relationship between you and your supporters is unique, only offering out-of-the-box solutions can limit your ability to get the most out of your data. That’s why we offer you full flexibility in building your own analytic scorecard based on your own data. To make sure you’re up and running as quickly as possible we also offer out-of-the-box analytic widgets tailored to sports, to capture the most relevant KPIs.
Discover Data Talks Customer Data Platform
Connect your insights to action and follow up on your marketing efforts in five easy steps.
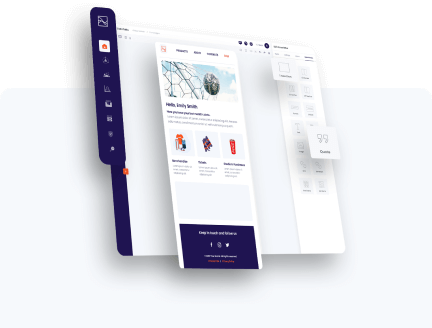
Set up your own analytics dashboards in our Analytics Framework using drag and drop.
Step 1
Create how many purpose-specific dashboards in our Analytics feature as you’d like. In each dashboard, you’re fully flexible to add as many analytic scorecards as you’d like.
Step 2
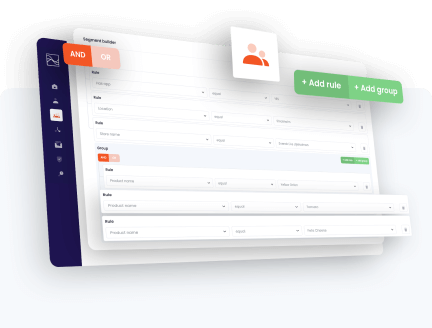
Using drag and drop, add as many scorecards as you’d like. For each scorecard you add, define which data or metric you would like to analyze by, measure by, filter by, and order by.
Step 3
Your analytics dashboards are real-time which means they will be continuously updated with relevant data and you can simply follow the progress.
Step 4
When you have set up your analytics dashboard to track the KPIs you need you can start evaluating how well your overall marketing strategy is performing and identify where you need to make improvements.
Step 5
Follow-up continuously and continue to add relevant scorecards based on your data and you will continue to maximize your marketing strategy.